Skip to content

Recent Posts

Measuring Crime Concentration (Part 1)

What constitutes concentration? In these articles we ask:

  • how do we count crimes? And how do we account for and control for heterogeneity in our observations (units with different area and populations)?
  • how do we decide if crime is concentrated? What measures are traditionally used?
  • if crime is purely random and thus isn't concentrated in any meaningful sense, will we still measure some concentration using traditional measures?
  • can we develop a "null hypothesis" statistical model to create a baseline measure, allowing us to differentiate between random and structural effects? What features must this model have to be realistic?
  • how do we develop this into a useful measure?
Why is all this maths important?

An introduction to the rationale behind our analytical approach

This post is the first in a short blog series designed to accompany the analyses, documentation and reproducible code developed as part of our Safer Streets project. While the technical outputs are aimed at transparency and reusability, this series provides a more accessible commentary on the why behind the what - why we’re doing what we’re doing, and why it matters for policing and crime prevention practice.


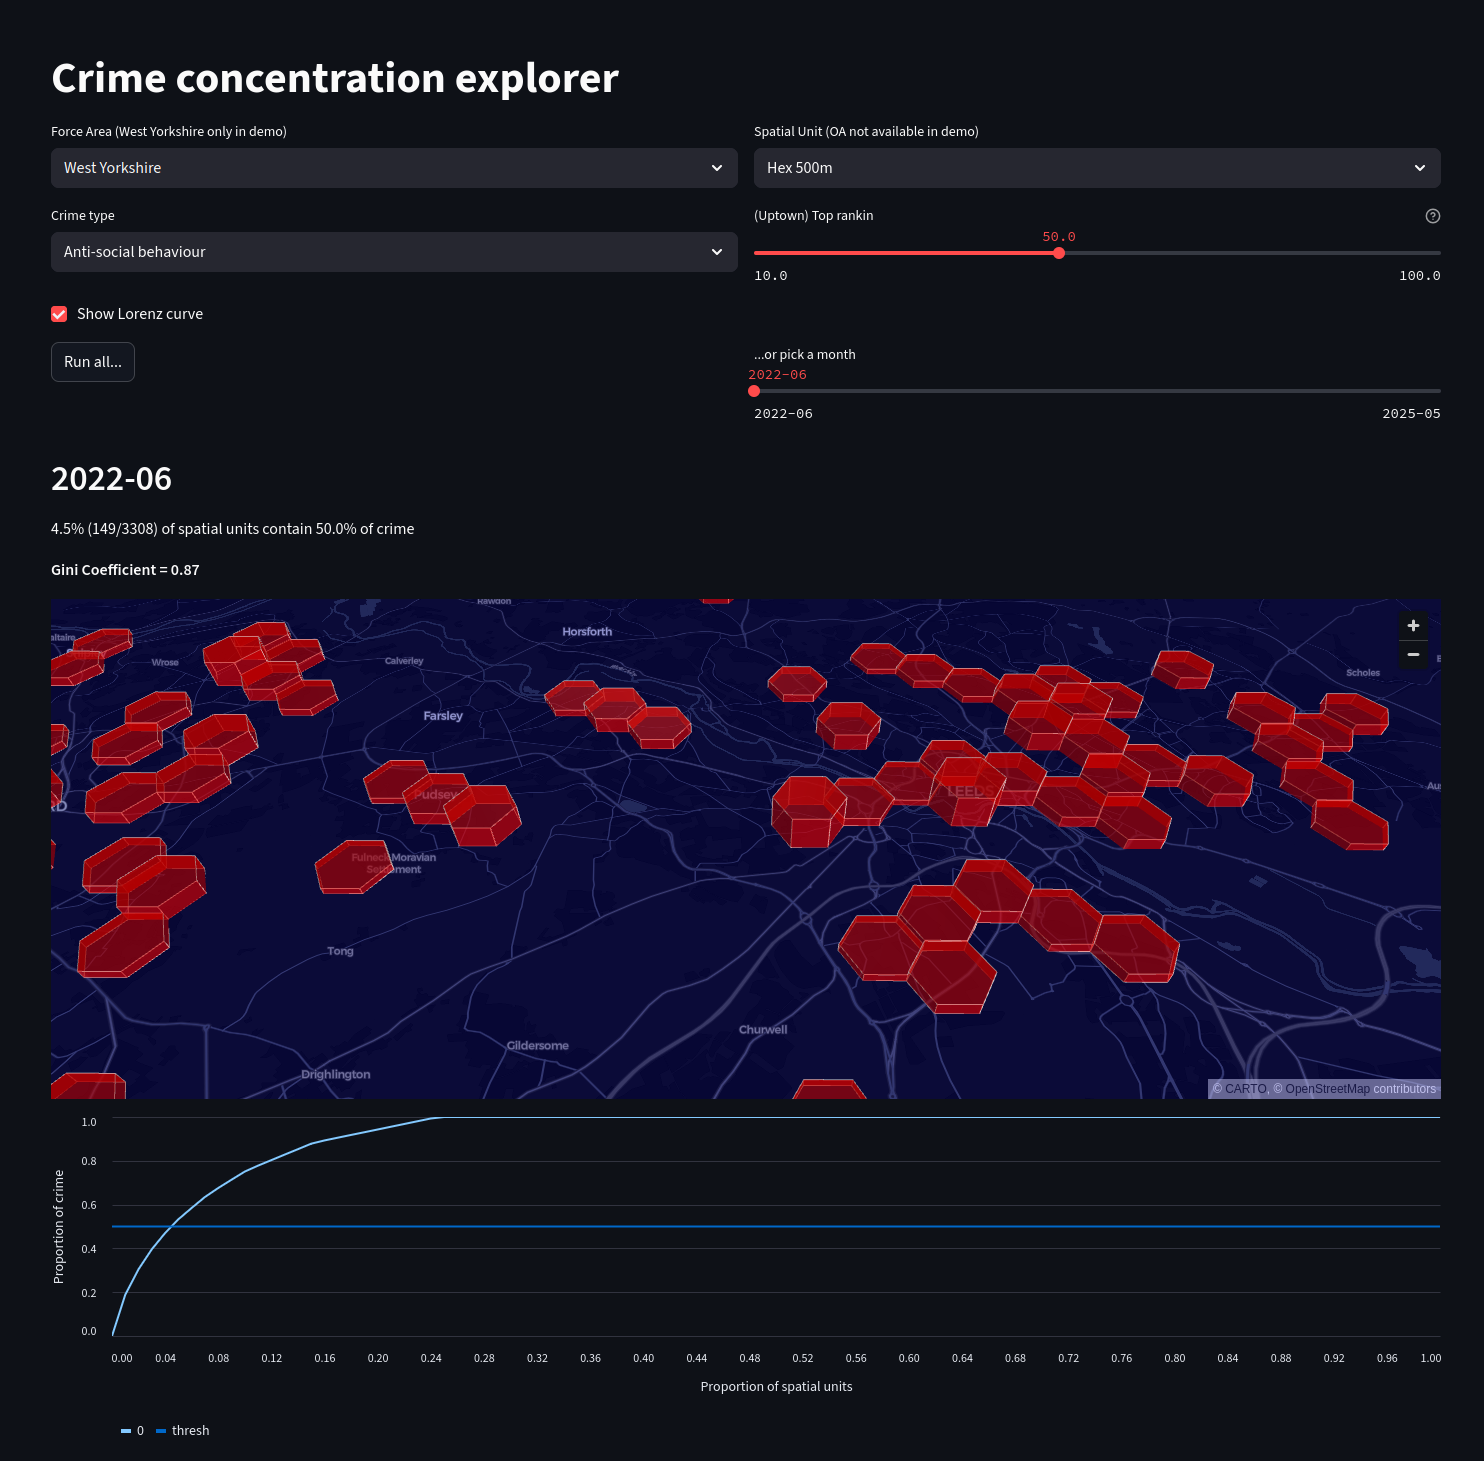
Crime Concentration Explorer

Update

Since its original publication, the demo app mentioned in this article has been replaced with an evolving multipage app with greater coverage and functionality. Links in this page have been updated to point to the newer implementation.

screenshot

Rationale

This app has been built as a proof-of-concept tool for practitioners and policymakers with an interest in the patterns of crime concentration, using only publicly available data. It enables users to visualise crime hotspots over time for a given Police Force Area (PFA).