Skip to content

Andrew Smith

Scaling Up

As we're progressing with nationwide and force-specific hotspot determination we have had to reassess some of the tooling we've been using so far, particularly for presenting and disseminating results, and with a view to producing practical tools for practitioners and policymakers.

We've started to hit performance limitations with geopandas so are switching a lot of the CPU-intensive spatial code to use an ephemeral duckdb instance with the spatial extension. This is exceptionally fast, able to load 3 years of national crime data (~18m incidents, England & Wales) from over 1500 individual parquet files, and group the crimes into 200m hex cells (~1.5m) - all in well under 10 seconds.

We've previously used Streamlit as a front-end (see here) but it's also not scaling well, proving somewhat inflexible and has compatibility issues with duckdb, so we're looking at alternatives. Later in the project we'll post a more definitive article on recommendations for the best (python) tooling, but in the meantime we're excited about the possibilities duckdb enables and want to share some progress...

Measuring Crime Concentration (Part 2)

We demonstrated in part 1 that random data with no structural concentration will exhibit some concentration using the traditional measures. In this article we taker a deeper dive into this claim.

Recall that our null hypothesis was that crimes are not concentrated, crime is is no more or less likely to occur in any given spatial unit, and the chance of a crime occurrence is not affected by previous events.

Motivating example - Seasonality

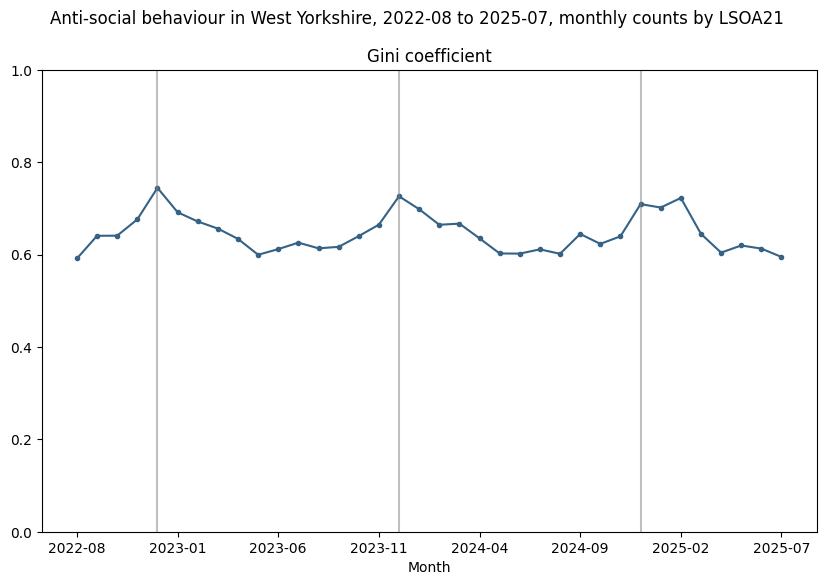
Public crime data in the UK contains precise (but obfuscated) location data, imprecise temporal information (the month of occurrence) and broad categorical information (around a dozen categories). Taking 3 years of data for incidents of ASB in West Yorkshire, aggregating crime into spatial units (in this case LSOA) we can plot a graph of (naive) Gini over time.

This graph shows some clear seasonality - concentration increases in the winter and decreases in the summer. A fairly obvious explanation for this would be that since antisocial behaviour generally occurs outdoors, there are simply more outdoor gatherings in warmer weather and longer daylight hours, therefore more opportunities.

Gini seasonality

However, more careful analysis of the data shows the apparent seasonality is an illusion. Here's why...

Demographics

When we look at crime counts at different spatial scales, it is often useful to try to understand the demographics of the area. Older people are more likely to be victims of certain crimes, for instance, and for others there are often correlations between crime incidence and the deprivation, socioeconomic status or other makeup of the area.

The UK census is the biggest source of demographic data, providing many attributes over various spatial scales. With census data there is always a tradeoff between spatial and categorical resolutions, often to preserve anonymity. For example, the highest spatial resolution for counts of people by age in years is MSOA, and at higher resolutions (LSOA, OA) age is only given in 5-year bands.

Another very important consideration is that we will want to aggregate people to non-statistical geographies, such as grids and hexes. In order to do this, we could simply place people at random points within the statistical geography, then take those that fall within the new geography. However this can be unrealistic, particularly in areas that are rural or contain large-scale non-residential infrastructure or bodies of water (despite Monty Python's boasts, nobody in Yorkshire lives under a lake!).

Measuring Crime Concentration (Part 1)

What constitutes concentration? In these articles we ask:

  • how do we count crimes? And how do we account for and control for heterogeneity in our observations (units with different area and populations)?
  • how do we decide if crime is concentrated? What measures are traditionally used?
  • if crime is purely random and thus isn't concentrated in any meaningful sense, will we still measure some concentration using traditional measures?
  • can we develop a "null hypothesis" statistical model to create a baseline measure, allowing us to differentiate between random and structural effects? What features must this model have to be realistic?
  • how do we develop this into a useful measure?

Crime Concentration Explorer

Update

Since its original publication, the demo app mentioned in this article has been replaced with an evolving multipage app with greater coverage and functionality. Links in this page have been updated to point to the newer implementation.

screenshot

Rationale

This app has been built as a proof-of-concept tool for practitioners and policymakers with an interest in the patterns of crime concentration, using only publicly available data. It enables users to visualise crime hotspots over time for a given Police Force Area (PFA).