Demographics
When we look at crime counts at different spatial scales, it is often useful to try to understand the demographics of the area. Older people are more likely to be victims of certain crimes, for instance, and for others there are often correlations between crime incidence and the deprivation, socioeconomic status or other makeup of the area.
The UK census is the biggest source of demographic data, providing many attributes over various spatial scales. With census data there is always a tradeoff between spatial and categorical resolutions, often to preserve anonymity. For example, the highest spatial resolution for counts of people by age in years is MSOA, and at higher resolutions (LSOA, OA) age is only given in 5-year bands.
Another very important consideration is that we will want to aggregate people to non-statistical geographies, such as grids and hexes. In order to do this, we could simply place people at random points within the statistical geography, then take those that fall within the new geography. However this can be unrealistic, particularly in areas that are rural or contain large-scale non-residential infrastructure or bodies of water (despite Monty Python's boasts, nobody in Yorkshire lives under a lake!).
To do this reasonably accurately we need to have some idea of the geography within the areas, to avoid placing people in nonsensical locations. One way to achieve this is to use the street network. OSM provide detailed street networks including classifications, so we can even limit to certain types of streets - i.e. residential - making the assignment even more realistic.
The next step is to place people onto the (residential) street network
Example
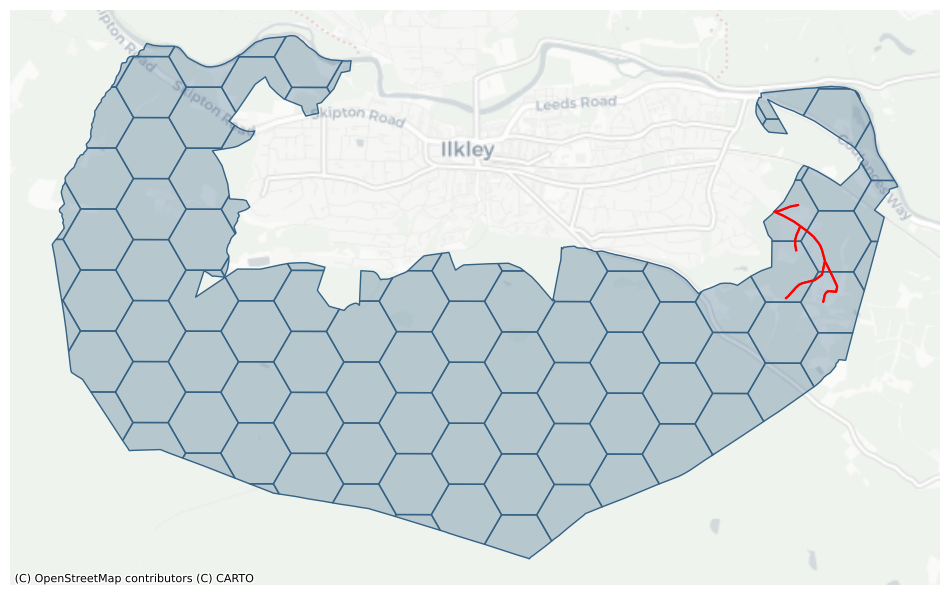
We want to realistically re-aggregate the population of the census output area E00053954 to a 250m hex grid.
This output area has been deliberately chosen as it covers a relatively very large 11km² (compared to the West Yorkshire average of 0.28km², and the hex cell area of 0.16km²) with a very uneven population distribution.
It has a population of 293 (West Yorkshire average is 320). Most of this area is uninhabited moorland, and is crossed by largely non-residential main roads. Residential streets are clustered in the east of the area (shown in red in the map below).
The methodology we use is a three-step process:
- using appropriate census table(s), generate a population with the required attributes (e.g. age, sex, ethnicity, socioeconomic status) consistent with the totals for the output area
- assign each person to a randomly sampled point on the street network within the output area.
- spatially join the points with the new features and aggregate as required
This is relatively efficient: as the first two steps are independent of the choice of new feature, the population data from step 2 can be cached and reused.
Using the example output area above, this would result in the population of 293 people being assigned to hexes like so:
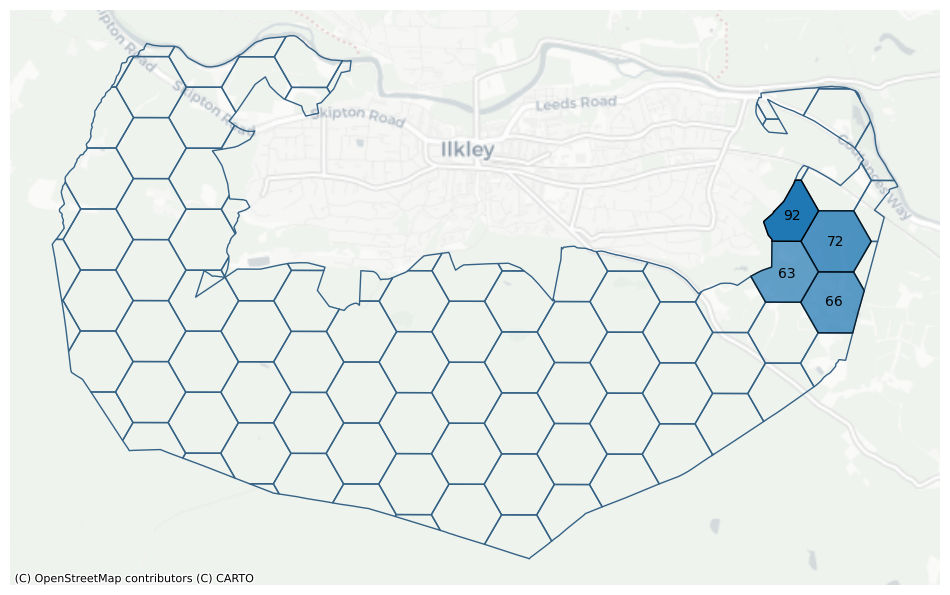
Although this illustrative example only covers a single output area, in practice, the assignment is carried out over an entire Police Force Area, and, rather than having truncated grid cells on the edges of output areas, population is be assigned to the full cell from all the intersecting output areas.
Limitations
This methodology treats each individual separately and cannot capture households or clusters of individuals with shared traits (such as ethnicity). Census data does not capture any spatial heterogeneity of categorical features within the output area.
People are assigned locations at random on street segments that are classified as residential, except for the occasional cases where output areas contain no residential streets (e.g. communal residences) - where people are just assigned random locations within the output area.
Further Development
If retaining household structure became desirable, the census does provide household-level statistics and locations of people could be grouped accordingly. Another possibility is to use OSM building data rather that street data - but at the time of writing the data quality is an issue, with missing data and inconsistent building classifications.