Crime Concentration Explorer
Update
Since its original publication, the demo app mentioned in this article has been replaced with an evolving multipage app with greater coverage and functionality. Links in this page have been updated to point to the newer implementation.
Rationale
This app has been built as a proof-of-concept tool for practitioners and policymakers with an interest in the patterns of crime concentration, using only publicly available data. It enables users to visualise crime hotspots over time for a given Police Force Area (PFA).
The use of public data (crime data from data.police.uk) imposes some limitations: although we have precise (albeit slightly perturbed) location data, we only have rough temporal information (the month the crime occurred) and a dozen or so broad categories of crime. The Safer Streets project is concerned specifically with antisocial behaviour (ASB), knife crime and violence against women and girls (VAWG). While ASB is represented in the data, the demo app proxies the broader Possession of weapons and Violence and sexual offences categories for knife crime and VAWG.
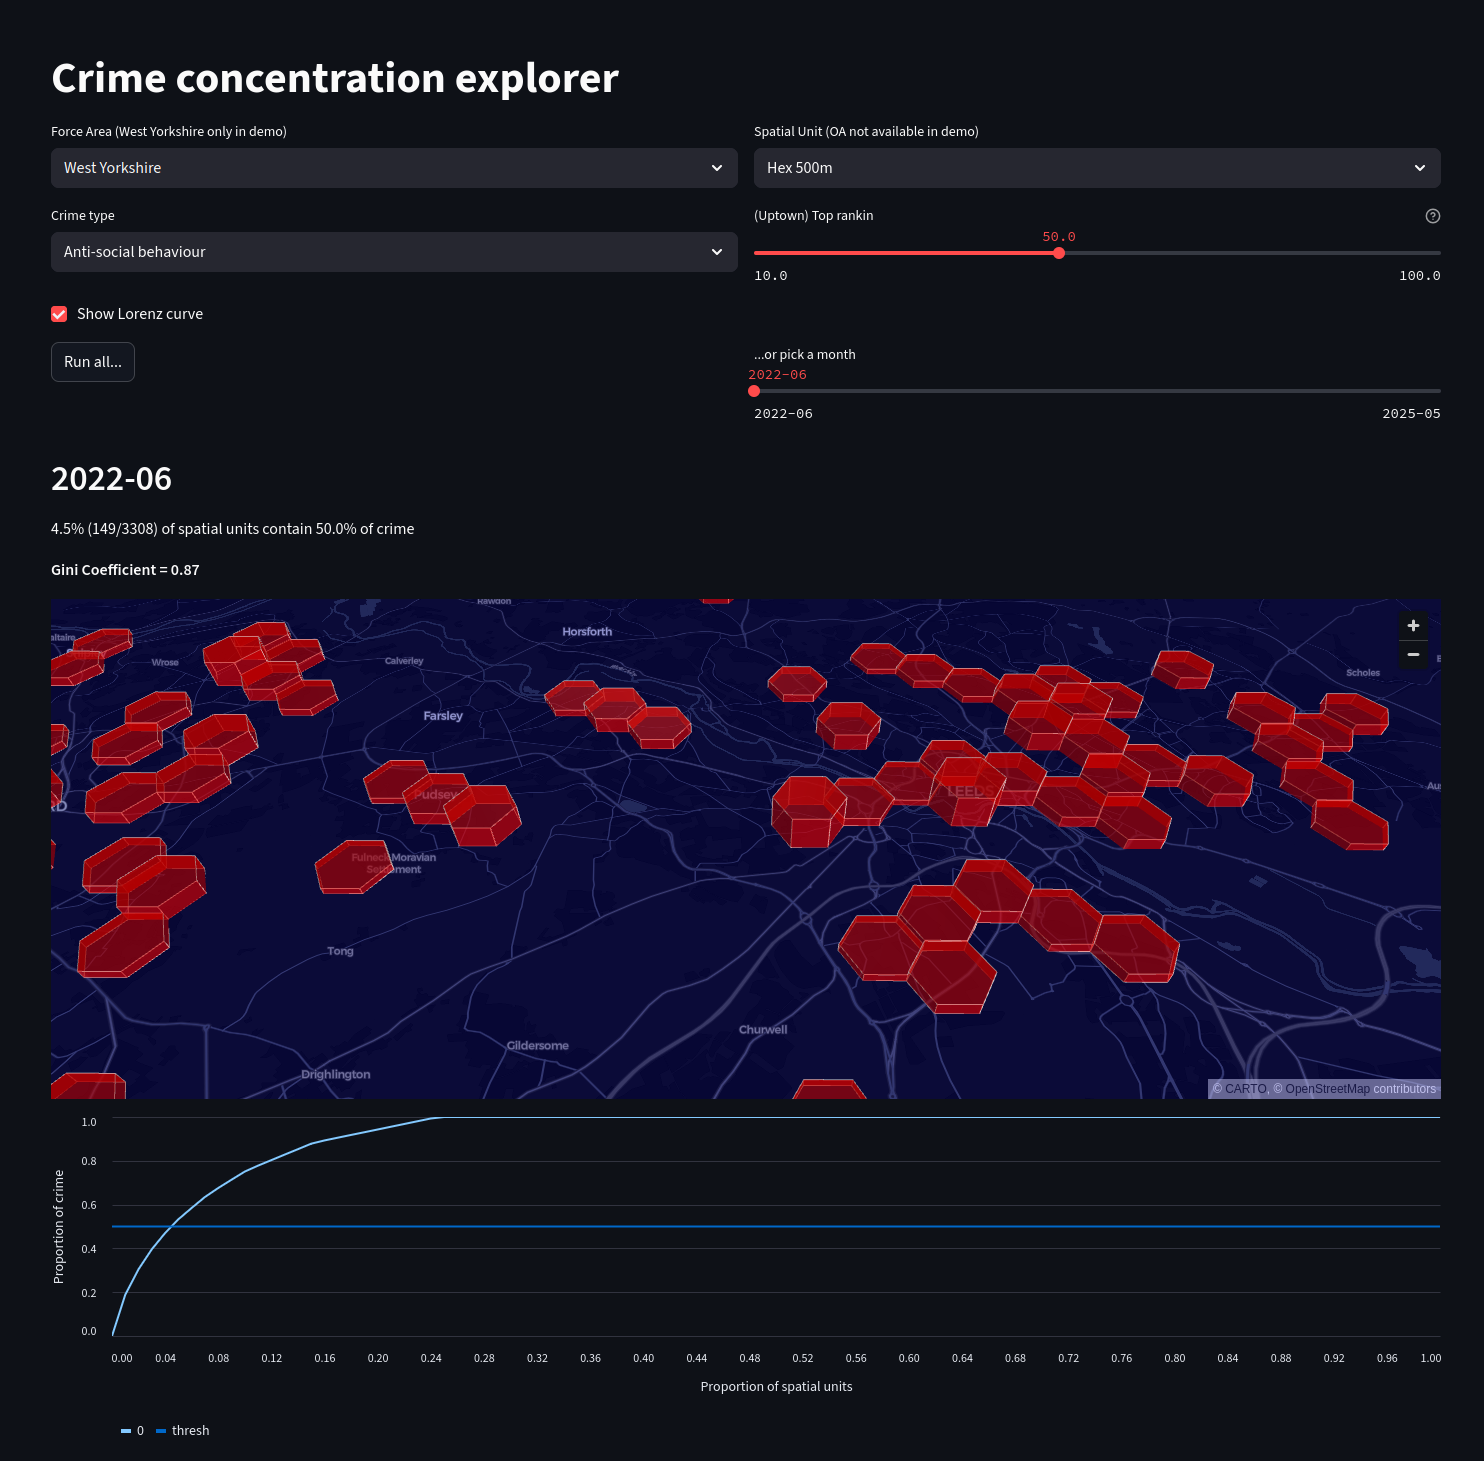
Users can select the PFA, crime type, spatial units, the degree of concentration1, then run the analysis over 3 years or inspect specific months. Counts per spatial unit are displayed on an interactive map and, optionally, a Lorenz curve is shown. The Gini coefficient is displayed.
Implementation
The app is built in the python streamlit framework, using pydeck for map visualisations and altair for graphs.
Data is handled using pandas and geopandas for geospatial data.
Whilst the raw crime data is cached, aggregation to spatial units is done on-the-fly. The smaller the spatial units, the longer this will take.
The code for the demo app is here
Limitations
The app is currently deployed on Streamlit's own free-tier cloud which imposes limitations on total app size (including data). To keep within this limit the data available to the demo app has been restricted:
- West Yorkshire PFA only
- the choice of spatial unit is restricted (notably omitting output areas and street segments)
- 3 years of crime data
Additionally, due to the use of public data, temporal resolution is limited to monthly units.
Further work
The demo app was implemented within the exploratory data analysis (EDA) repo, as it required many of the code components developed there. Those components and the app itself have been factored out into separate repos, which will simplify future deployment.
A full-fat version of the app with full datasets will be provided when we have suitable cloud provisioning.
Link
Try the app for yourself!
https://uol-a011-prd-uks-wkld025-asp1-app1.azurewebsites.net/
-
this refers to the smallest set of spatial units - i.e. those with most crime - that contain a set percentage of the total crime for a given month. For example, you may be able to capture 50% of crime in only 5% of spatial units. ↩